Prometheus
概述
参考 Prometheus 文中关于 Prometheus Server 的部署我们发现,手动来维护 Prometheus Server 是相当费力的,而在 kubernetes 中,可以借助 operater 帮助我们来完成 Prometheus Server 的创建与维护工作,甚至连自动发现配置都可以。
Prometheus CRD 部署
当在 k8s 中部署了 operator 之后,部署 Prometheus Server 就变成了声明一个 Prometheus 资源。
这是声明一个 Prometheus 类型的资源的 manifest 示例:
apiVersion: monitoring.coreos.com/v1
kind: Prometheus
metadata:
  name: test
  namespace: monitor
spec:
  replicas: 1
  serviceAccountName: prometheus
注意:
- 由于 Prometheus Server 容器需要读取集群内其他资源对象的数据,所以需要给 Prometheus 资源生成的 Pod 一个足够权限的 serviceAccount。
kubectl create -n monitor serviceaccount prometheus
kubectl create clusterrolebinding prometheus-admin --clusterrole=cluster-admin --serviceaccount=monitor:prometheus
声明好 Prometheus 资源,则会看到一个名为 test 的 Prometheus 对象;该对象会自动帮助我们创建一个名为 prometheus-test 的 Statefulsets 对象;这个 Statefulsets 中的 pod 包括 2 个容器,1 个 Prometheus Server 容器,和 1 个 sidecar container;还会有一个 service 来关联到这些 pod 上
[root@master-1 prometheus-operator]# kubectl get -n monitor prometheus
NAME   VERSION   REPLICAS   AGE
test             1          2m17s
[root@master-1 prometheus-operator]# kubectl get -n monitor statefulsets.apps
NAME              READY   AGE
prometheus-test   1/1     2m20s
[root@master-1 prometheus-operator]# kubectl get -n monitor pod
NAME                                   READY   STATUS    RESTARTS   AGE
prometheus-operator-6cdb7d79fb-mgv97   1/1     Running   0          4m49s
prometheus-test-0                      2/2     Running   0          73s
[root@master-1 prometheus-operator]# kubectl get -n monitor service
NAME                  TYPE        CLUSTER-IP   EXTERNAL-IP   PORT(S)    AGE
prometheus-operated   ClusterIP   None         <none>        9090/TCP   2m57s
prometheus-operator   ClusterIP   None         <none>        8080/TCP   5m12s
[root@master-1 prometheus-operator]# kubectl get -n monitor pod prometheus-test-0 -oyaml | neat | grep image
    image: quay.io/prometheus/prometheus
    image: quay.io/prometheus-operator/prometheus-config-reloader:v0.45.0
- quay.io/prometheus/prometheus # Prometheus Server 主程序
- quay.io/prometheus-operator/prometheus-config-reloader:v0.45.0 # 处理 ServiceMonitor、PodMonitor、PrometheusRule 获取到的配置信息,并传递给上面的 prometheus 容器
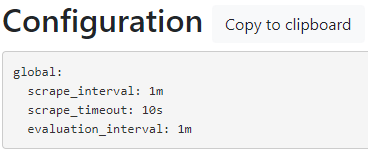
这时候一个 Prometheus Server 就部署完成了,可以使用 kubectl port-forward -n monitor service/prometheus-operated 9090:9090 –address=0.0.0.0 命令来暴露服务的端口,然后访问 https://HostIP:9090,就可以看到 prometheus 的 web 界面了
现在的 Prometheus 没有任何配置,如图所示。
 如果想要给 prometheus 添加配置,则需要使用 ServiceMonitor、PodMonitor 这些 CRD,或者为 Prometheus 对象添加 additionalScrapeConfigs 字段来引用附加配置,不能直接手动修改配置文件,因为配置文件是通过 sidecar 容器 自动生成的,就算手动修改了也会被还原,因为 operator 会持续监测配置文件与其他方式获取的配置内容是否匹配。
Prometheus 生成的 Pod 资源的组成
包含 2 个容器,共享部分 volume
- prometheus # Prometheus Server 主程序。
- config-reloader # 处理 ServiceMonitor、PodMonitor、PrometheusRule 获取到的配置信息,并传递给上面的 prometheus 容器
Prometheus 容器
prometheus server 主程序,包括程序启动的一些参数也会提前设置好默认值,如下所示:
- args:
    - --web.console.templates=/etc/prometheus/consoles
    - --web.console.libraries=/etc/prometheus/console_libraries
    - --config.file=/etc/prometheus/config_out/prometheus.env.yaml
    - --storage.tsdb.path=/prometheus
    - --storage.tsdb.retention.time=24h
    - --web.enable-lifecycle
    - --storage.tsdb.no-lockfile
    - --web.route-prefix=/
  image: quay.io/prometheus/prometheus
  name: prometheus
  ports:
    - containerPort: 9090
      name: web
  readinessProbe:
    failureThreshold: 120
    httpGet:
      path: /-/ready
      port: web
    periodSeconds: 5
    timeoutSeconds: 3
  terminationMessagePolicy: FallbackToLogsOnError
  volumeMounts:
    # 配置文件存储路径,与 config-reloader 挂载同一个名为 config-out 的卷。config-reloader 会将处理好的配置文件放在该卷中。
    - mountPath: /etc/prometheus/config_out
      name: config-out
      readOnly: true
    - mountPath: /etc/prometheus/certs
      name: tls-assets
      readOnly: true
    - mountPath: /prometheus
      name: prometheus-test-db
    - mountPath: /etc/prometheus/rules/prometheus-test-rulefiles-0
      name: prometheus-test-rulefiles-0
配置文件使用 config_out 目录,挂载该目录的卷与下面的一个名为 prometheus-config-reloader 的容器的卷相同,所以配置文件是通过 prometheus-config-reloader 容器来生成的。
config-reloader 容器
该容器用于热更新 prometheus server 的主配置文件
ServiceMonitor 资源会将生成的配置文件写到名为 config 的 secret 中,然后该 container 解压该文件并拷贝到 config-out 卷中。由于 config-out 卷会挂载到该 container 与 prometheus 容器中,所以该卷内的文件也是共享的。然后该程序会执行参数中 reload-url 的的值,对 prometheus 的配置进行热更新
- args:
    - --listen-address=:8080
    - --reload-url=http://localhost:9090/-/reload
    - --config-file=/etc/prometheus/config/prometheus.yaml.gz
    - --config-envsubst-file=/etc/prometheus/config_out/prometheus.env.yaml
    - --watched-dir=/etc/prometheus/rules/prometheus-test-rulefiles-0
  command:
    - /bin/prometheus-config-reloader
  env:
    - name: POD_NAME
      valueFrom:
        fieldRef:
          fieldPath: metadata.name
    - name: SHARD
      value: "0"
  image: quay.io/prometheus-operator/prometheus-config-reloader:v0.45.0
  name: config-reloader
  ports:
    - containerPort: 8080
      name: reloader-web
  resources:
    limits:
      cpu: 100m
      memory: 50Mi
  terminationMessagePolicy: FallbackToLogsOnError
  volumeMounts:
    #
    - mountPath: /etc/prometheus/config
      name: config
      # 处理 config 卷中的内容,并生成 Prometheus Server 可读的配置文件,放在 config-out 卷中。
    - mountPath: /etc/prometheus/config_out
      name: config-out
    - mountPath: /etc/prometheus/rules/prometheus-test-rulefiles-0
      name: prometheus-test-rulefiles-0
Pod 中所使用的 volume
volumes:
  - name: config
    secret:
      secretName: prometheus-test
  - name: tls-assets
    secret:
      secretName: prometheus-test-tls-assets
  - emptyDir: {}
    name: config-out
  - configMap:
      name: prometheus-test-rulefiles-0
    name: prometheus-test-rulefiles-0
  - emptyDir: {}
    name: prometheus-test-db
- config # 通过 ServiceMonitor 等途径生成的配置文以 .gz 的压缩方式,保存在这个卷中
- 通过 ServiceMonitor 等途径获取的配置文件,放在这个卷中,经过 config-reloader 容器处理后,将生成的配置文件放到 config-out 卷中。
- 这个 prometheus-test 的 Secret 对象中存储的是配置文件的 .gz 格式的内容。
[root@master-1 prometheus-operator]# kubectl get secrets  prometheus-test -oyaml | neat
apiVersion: v1
data:
  prometheus.yaml.gz: ""
kind: Secret
metadata:
  annotations:
    empty: "true"
  labels:
    managed-by: prometheus-operator
  name: prometheus-test
  namespace: default
type: Opaque
- config-out# config 卷中的配置文件解压缩后保存在这个卷中。Prometheus Server 也挂载了这个卷,可以读取其中的配置文件。
- prometheus-test-db # Prometheus Server 的数据存储卷。这里默认是 emptyDir 类型,可以通过 PV 等方式持久化
Prometheus 配置文件的变化
serviceMontiroSelect
apiVersion: monitoring.coreos.com/v1
kind: Prometheus
metadata:
  name: test
  namespace: monitor
spec:
  replicas: 1
  serviceAccountName: prometheus
  serviceMonitorSelector: {}
添加该字段后,配置文件会增加一些内容
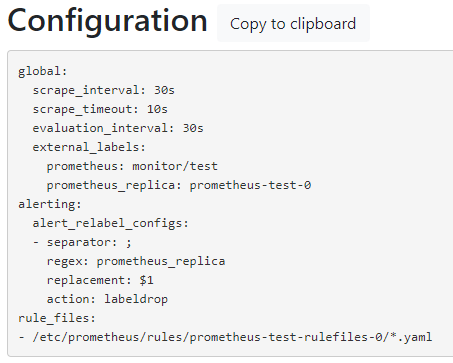 这些内容可以在 prometheus-test 这个 secret 中看到,可以看到,secret 中的内容就是配置文件压缩后进行 base64 编码后的值。
[root@master-1 prometheus-operator]# kubectl get secrets -n monitor prometheus-test -oyaml | neat
apiVersion: v1
data:
  prometheus.yaml.gz: H4sIAAAAAAAA/2yQPUuEMRCE+/yKLSxUiDmwSydo6UcvEvbiXAzsm7xscsf57yXxE7VbZnZmHzZJ3bJ4Q4QDy557riXk0qEHFk+Xm2aIWlRe8UfGsUMLSxDeQtooIVq1Lugv2DdPSy25V3Udrf8yg2KVHNnTyenD/XW4u7q9OTO6F4RdFjRvLDn06L4jbrjth2BHrx3qjNiNO7945UXMB2+sZZdT8/T4ZFigPZc0IOccFBP7a8sQWeI4HuBpWs9a14mtSDj6f+g/yxYunKDvp94CAAD//wMwvnNTAQAA
kind: Secret
metadata:
  annotations:
    generated: "true"
  labels:
    managed-by: prometheus-operator
  name: prometheus-test
  namespace: monitor
type: Opaque
[root@master-1 prometheus-operator]# echo "H4sIAAAAAAAA/2yQPUuEMRCE+/yKLSxUiDmwSydo6UcvEvbiXAzsm7xscsf57yXxE7VbZnZmHzZJ3bJ4Q4QDy557riXk0qEHFk+Xm2aIWlRe8UfGsUMLSxDeQtooIVq1Lugv2DdPSy25V3Udrf8yg2KVHNnTyenD/XW4u7q9OTO6F4RdFjRvLDn06L4jbrjth2BHrx3qjNiNO7945UXMB2+sZZdT8/T4ZFigPZc0IOccFBP7a8sQWeI4HuBpWs9a14mtSDj6f+g/yxYunKDvp94CAAD//wMwvnNTAQAA" | base64 -d > 123.gz
[root@master-1 prometheus-operator]# gzip -d 123.gz
[root@master-1 prometheus-operator]# cat 123
global:
  evaluation_interval: 30s
  scrape_interval: 30s
  external_labels:
    prometheus: monitor/test
    prometheus_replica: $(POD_NAME)
rule_files:
- /etc/prometheus/rules/prometheus-test-rulefiles-0/*.yaml
scrape_configs: []
alerting:
  alert_relabel_configs:
  - action: labeldrop
    regex: prometheus_replica
  alertmanagers: []
additionalScrapeConfigs
参考:
在使用 Prometheus Operator 时,会有一些很特殊的需求,无法通过 ServiceMonitor 或者 PodMonitor 来自动生成配置,这些配置,就可以通过 additionalScrapeConfigs 来添加到 Prometheus Server 的配置文件中。
我们可以按照原始的 Prometheus 的 scrape_config 配置环境的格式,写到一个 文件A 中,然后用 文件A 创建一个 Secret 对象。并在 additionalScrapeConfigs 字段中,引用这个 Secret 对象中的指定数据,即可将 文件A 的配置附加到 Prometheus Server 的配置文件中。
种方式常用来为 Prometheus Server 创建静态的 Scrape 配置。就是 scrape_cofig 配置环境中的 static_configs
比我,我们创建一个简单的抓取配置。假设命名为prometheus-additional.yaml
cat > prometheus-additional.yaml <<EOF
- job_name: "prometheus"
  static_configs:
  - targets: ["localhost:9090"]
EOF
然后,创建一个该文件的 Secret 对象。
kubectl create -n monitor secret generic additional-scrape-configs --from-file=prometheus-additional.yaml --dry-run -oyaml > additional-scrape-configs.yaml
这个 secret 应该是这个样子的
apiVersion: v1
data:
  prometheus-additional.yaml: LSBqb2JfbmFtZTogInByb21ldGhldXMiCiAgc3RhdGljX2NvbmZpZ3M6CiAgLSB0YXJnZXRzOiBbImxvY2FsaG9zdDo5MDkwIl0K
kind: Secret
metadata:
  creationTimestamp: null
  name: additional-scrape-configs
  namespace: monitor
创建这个 Secret 资源
kubectl apply -f additional-scrape-configs.yaml
最后,在 Prometheus 这个 CRD 中引用这个额外的配置
apiVersion: monitoring.coreos.com/v1
kind: Prometheus
metadata:
  name: test
  namespace: monitor
spec:
  replicas: 1
  serviceAccountName: prometheus
  serviceMonitorSelector: {}
  # 在这里引用 additional-scrape-configs 这个 secret 对象下的 .data 字段中,名为 prometheus-additional.yaml 的值。
  additionalScrapeConfigs:
    name: additional-scrape-configs
    key: prometheus-additional.yaml
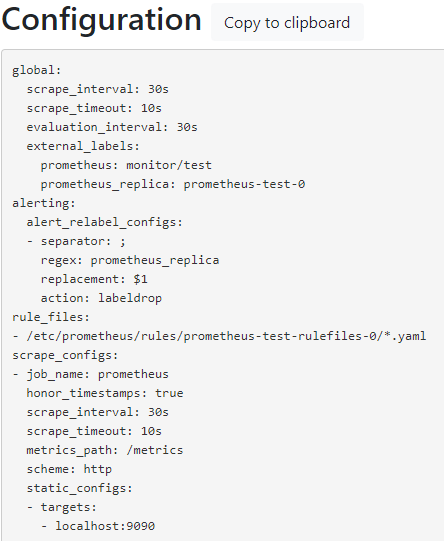
这时,在 Prometheus Server 中,就会多出一些 scrape_configs 里的配置:
 注意:
注意:
仅对所有的附加抓取配置使用一个 Secret。也就是说所有的附加配置都要写到一个文件里
现阶段 secret 与 prometheus 这俩资源必须在同一个名称空间下
反馈
此页是否对你有帮助?
Glad to hear it! Please tell us how we can improve.
Sorry to hear that. Please tell us how we can improve.